
 By
Martin Getov | CloudOps + DataOps Engineer | DataOps.live
By
Martin Getov | CloudOps + DataOps Engineer | DataOps.live
One of our main objectives at DataOps.live is cost-efficiency. Given our heavy use of cloud services, overspending on unused resources is a real concern.
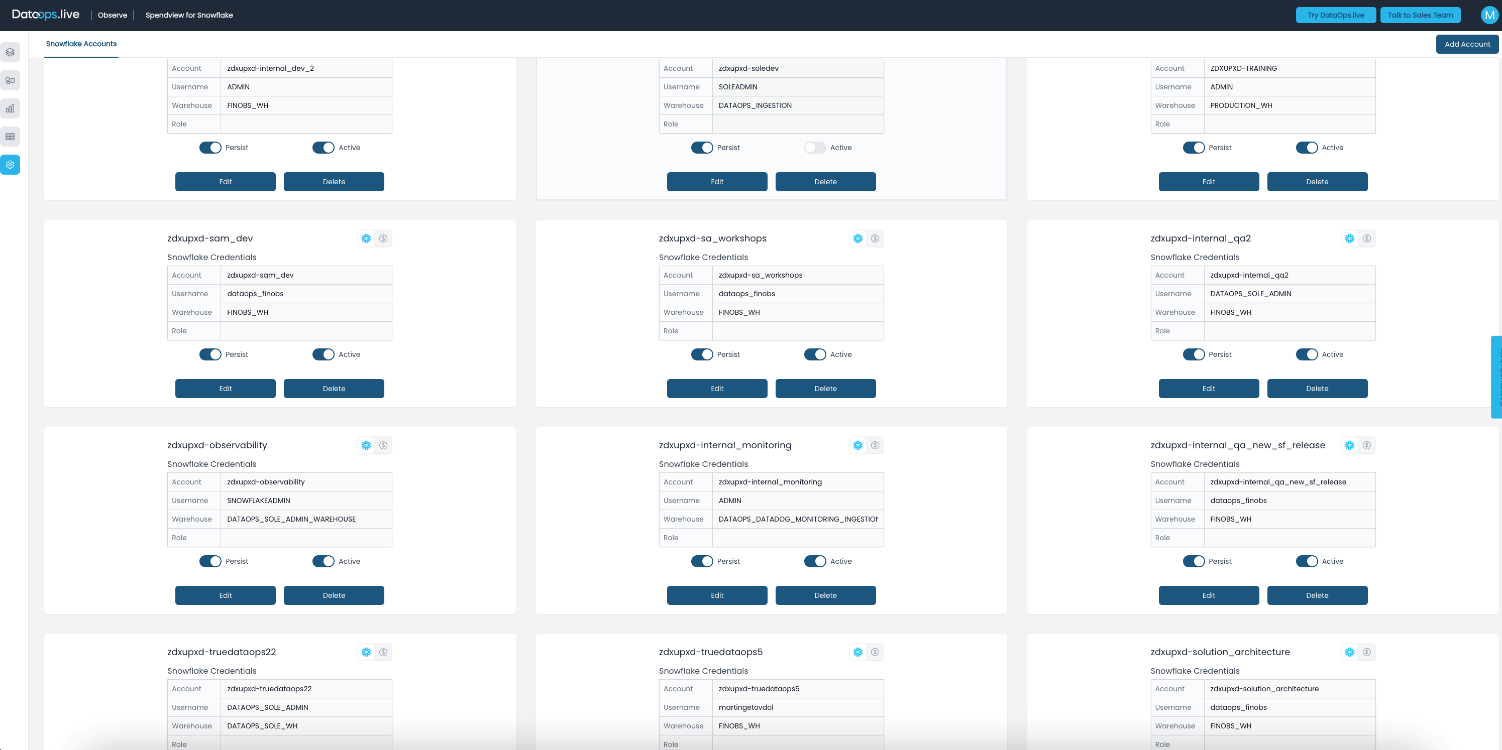
Our main goal is to speed up and improve how we build and manage data products on top of Snowflake. This involves the extensive use of Snowflake instances—currently 13. Managing all of these instances might sound tough, but it has actually been quite smooth, thanks to the management aspects of our DataOps.live platform and the robust features provided by our orchestrators.
However, we did find one crucial element missing from our setup: the ability to monitor our cloud costs.
Before we developed Spendview for Snowflake, we spent too much time manually examining each Snowflake instance, running queries to collect data, and then trying to put it all together. Now, using Spendview to its fullest has transformed our expense tracking. We can assess our spending and figure out where to save money, all in less than 10 minutes each month. In the first couple of months, we managed to reduce our internal spending by 30%!
Let me walk you through the steps we take to simplify managing our cloud costs using Spendview. Hopefully, you'll find this process helpful for your organization.
Step 1: Spend Overview Across Accounts
Let’s start with a weekly overview of spending across accounts. This can help you find any significant increases then compare the current month’s cost to the previous month’s.
In our world of over ten active Snowflake instances, variation in usage is natural.
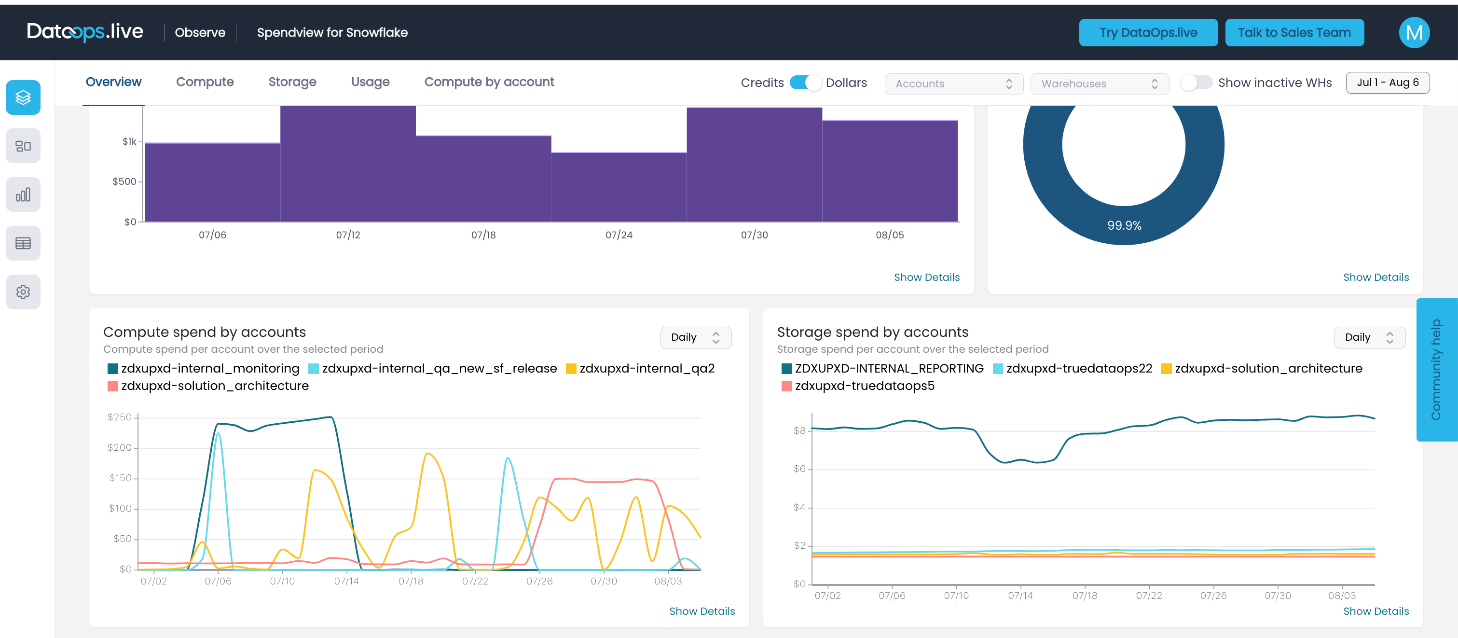
The Spendview Overview tab provides a broad weekly overview across all accounts.
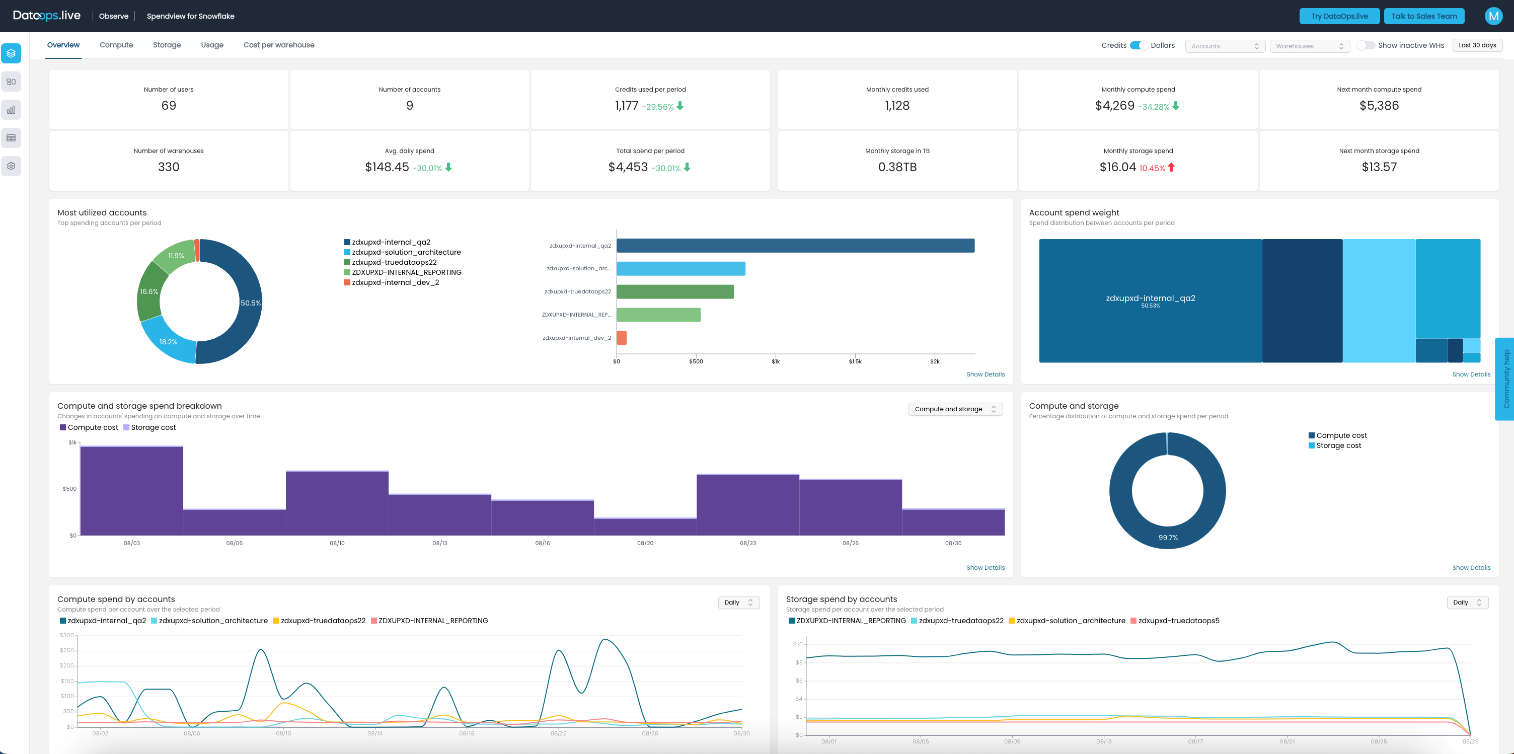
Here, we look at a couple of things:
- The numbers in the cross-account summary metrics to see if we have a significant increase in the expenses or not. There is a percentage indicator that helps compare the current month’s spend with the previous one. As the screenshot shows, this month we spent 30% less than last month. That’s a win! You may be wondering how we have achieved this… Well, in the previous month, we had two unrealized resource spikes (spend) each for about a week. I'll come back to them further in the article.
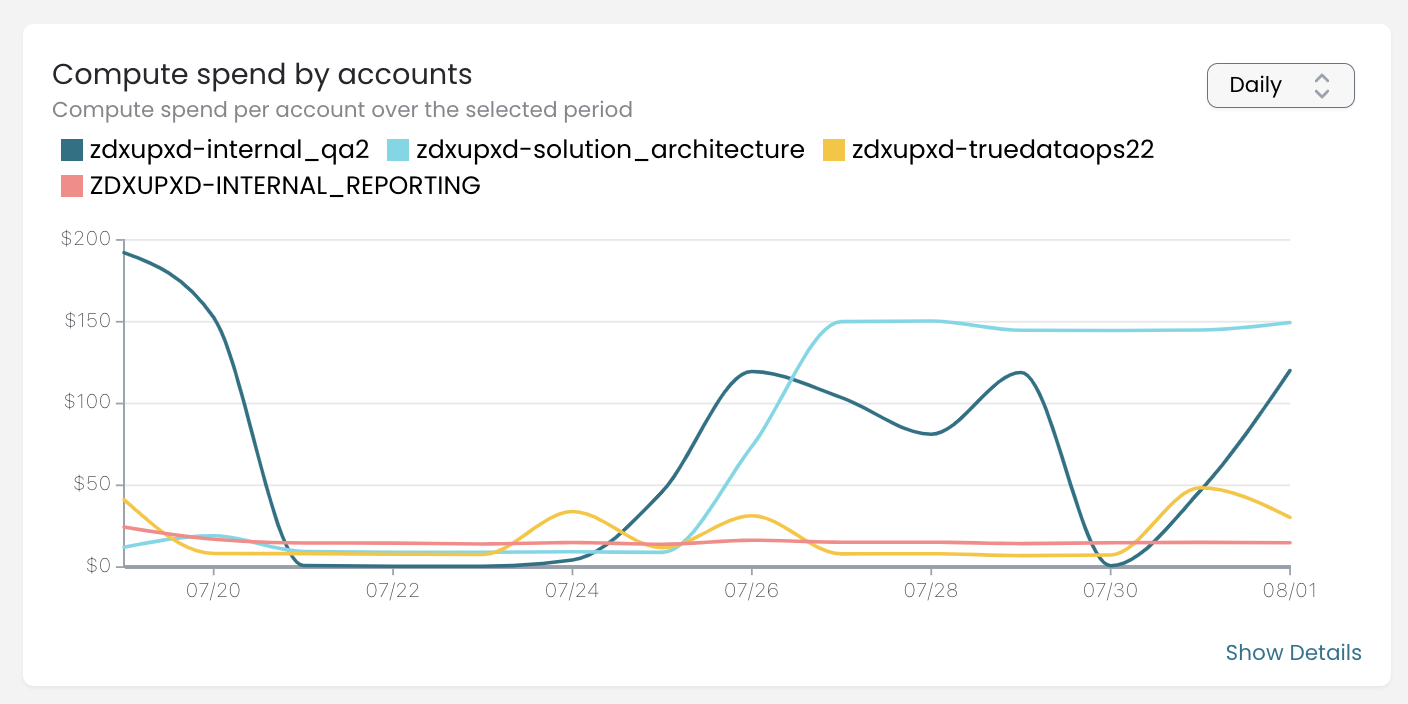
- The details in the “Compute spend by accounts” widget. For this month, it looks like below:
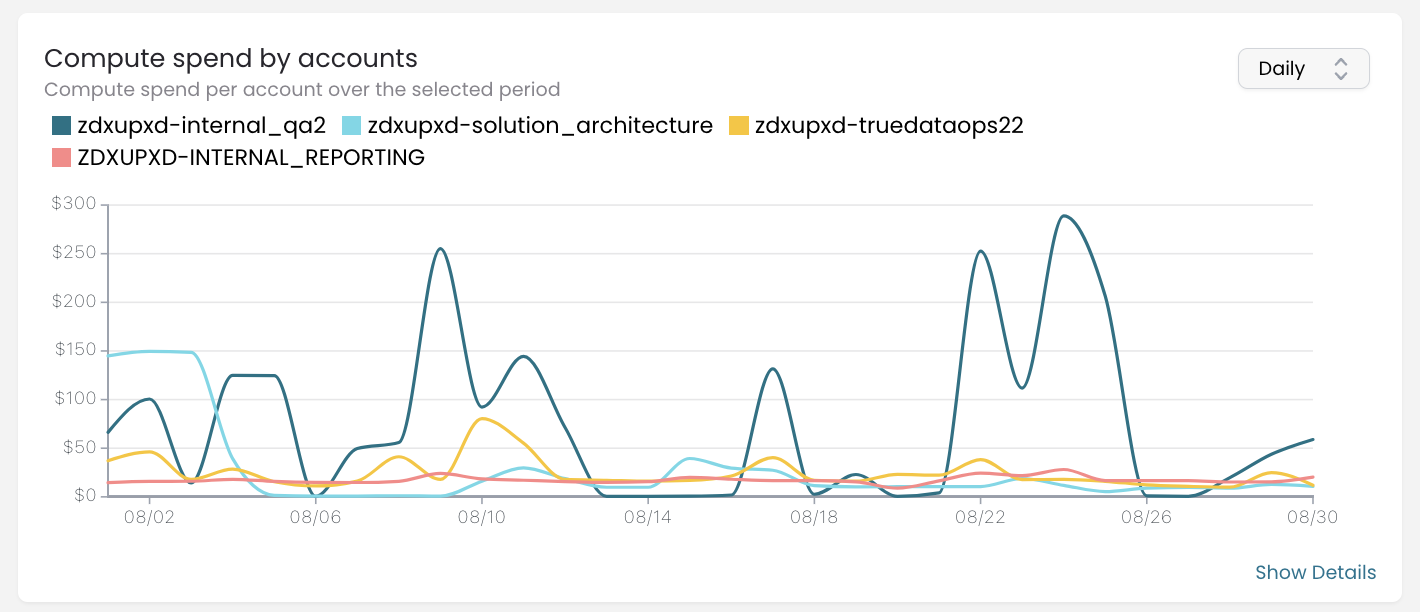
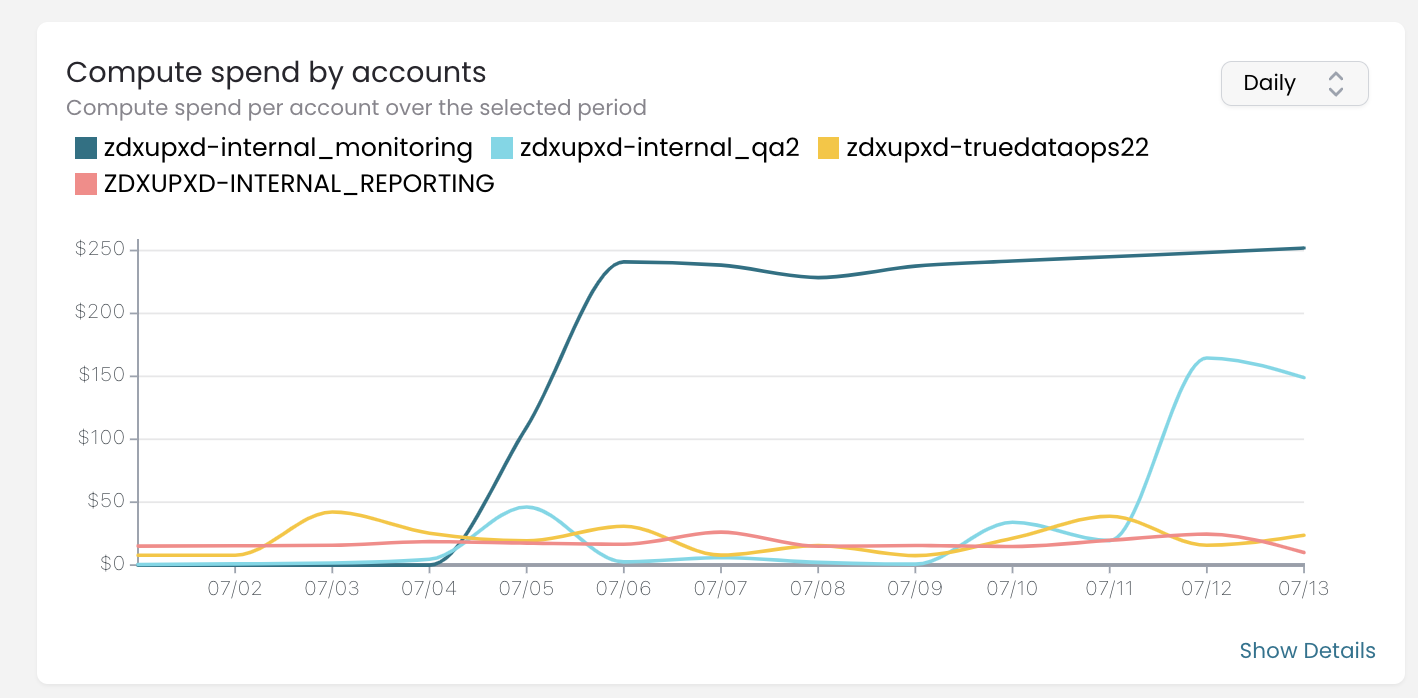
You can see that for some accounts, there are spikes, while others keep a consistent daily spend. I expect spikes in the zdxupxd-itnernal-qa2 account since we are using it to test new features after we complete development. For the days with active testing, it is normal to have spikes. To show you how valuable this chart can be, I will share how it looks for July:
This chart shows our compute spend from July 1st to August 5th. As I mentioned earlier, we expect the spikes in the internal_qa2 instance, but here we can see two huge spikes for a couple of days in two different accounts. You can see the exact date when we found and fixed the issues.
Before diving deeper into the details of these non-utilized spends, let me show the chart on the days we used to discover these spends:
Now that we have seen some suspicious account behavior, let's see what steps we can take to find the root cause.
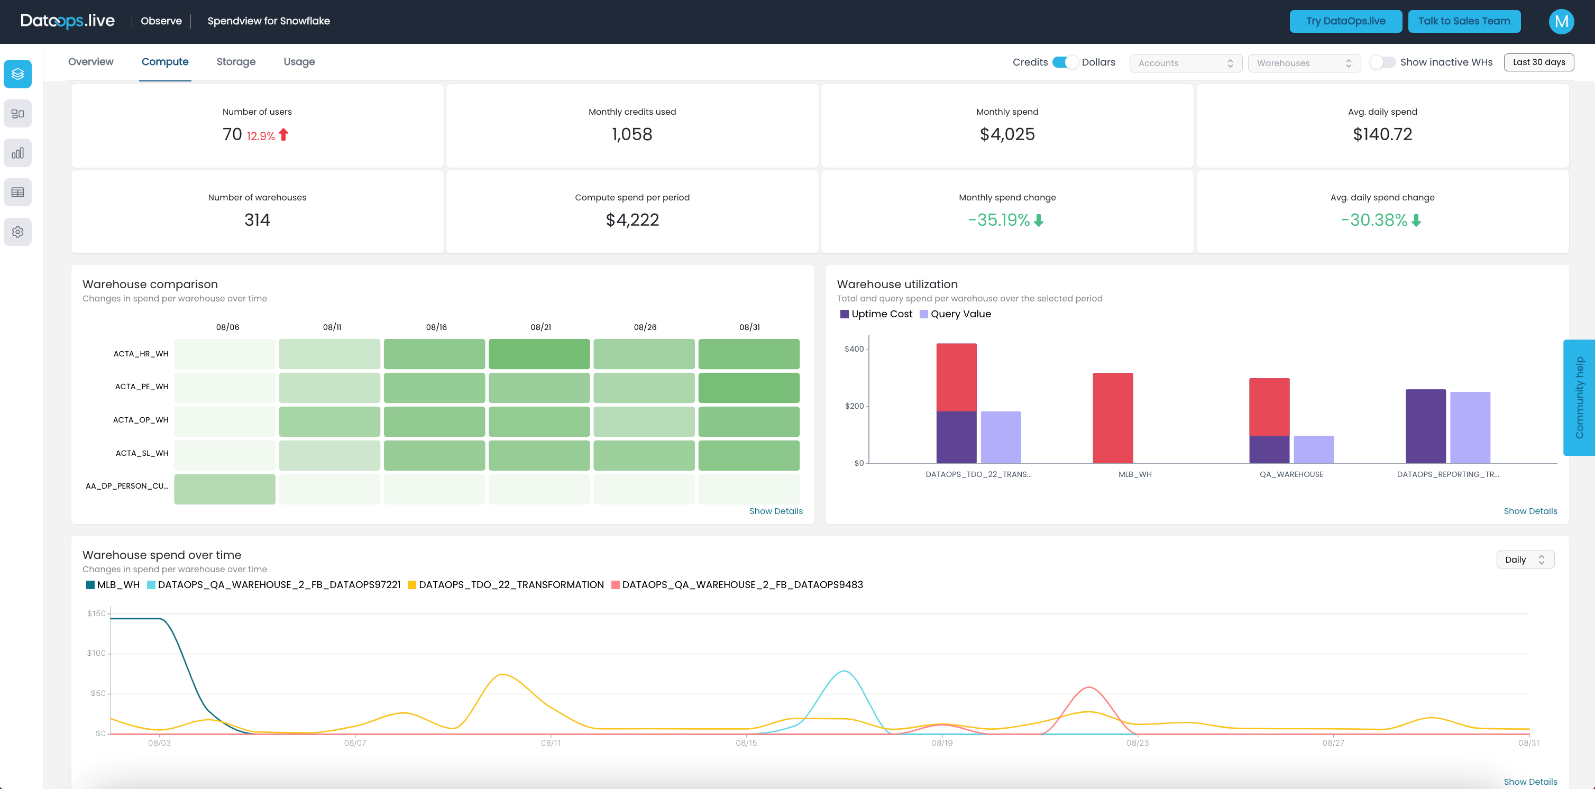
Step 2: Drill Down on Compute Spend to Find Potential Cost-Savers
By looking in more detail at compute spend, we’ll find underutilized resources and potential areas for cost-cutting.
Let’s go step-by-step through two scenarios where warehouses are being used inefficiently.
Take a look at this screenshot:
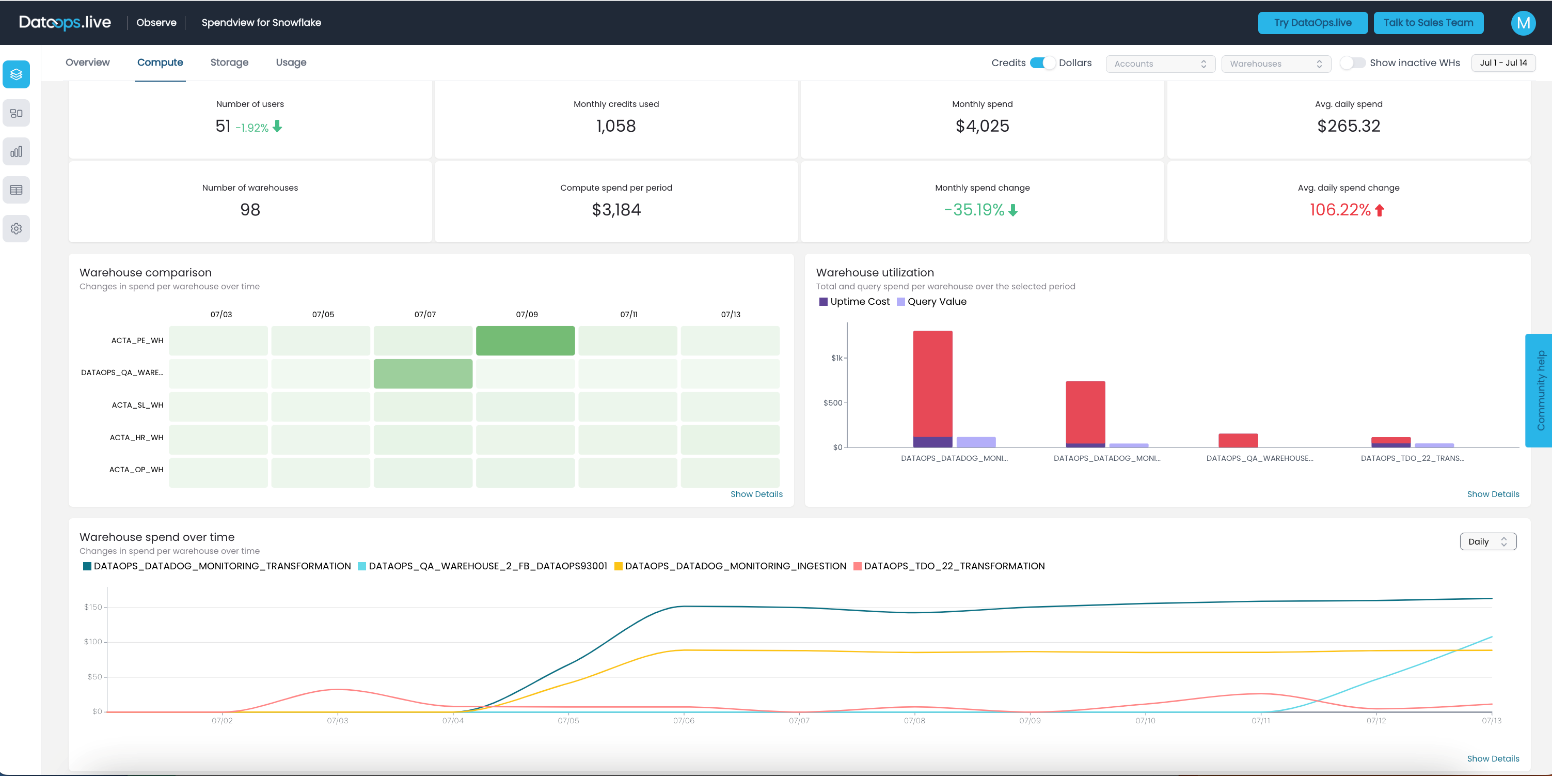
We can see that the top two warehouses are not being well used. In both cases, we have some query value, but it’s much lower than the uptime cost. This means that we have some processes running, but we likely do not need a dedicated warehouse for them. Upon closer examination, we figured out that this 100% uptime was caused by a pipeline running every 5 minutes. The pipeline was transferring a very low amount of data, but since we had multiple jobs using different warehouses and the suspending time was set to the default 10 mins, it turns out that both warehouses were always up and running. This dynamic was generating more spending than value.
To address this issue, we decided to move this process to another warehouse, which is also used by other processes. Additionally, we adjusted the pipeline to run once every 2 hours instead of every 5 minutes. By doing so, we kept the value the pipeline was generating but significantly reduced the money we were spending and made our Snowflake a lot more efficient.
Now, let’s look at another instance:
In this case, you can tell that the first warehouse is up and running, and no queries are triggered against it. We suspended it and turned on the auto-suspend feature with a 1-minute threshold. It turned out that this was a test warehouse. Fortunately, with the help of Spendview and just 10 mins of monitoring every week, we made our Snowflake accounts a lot more cost-efficient.
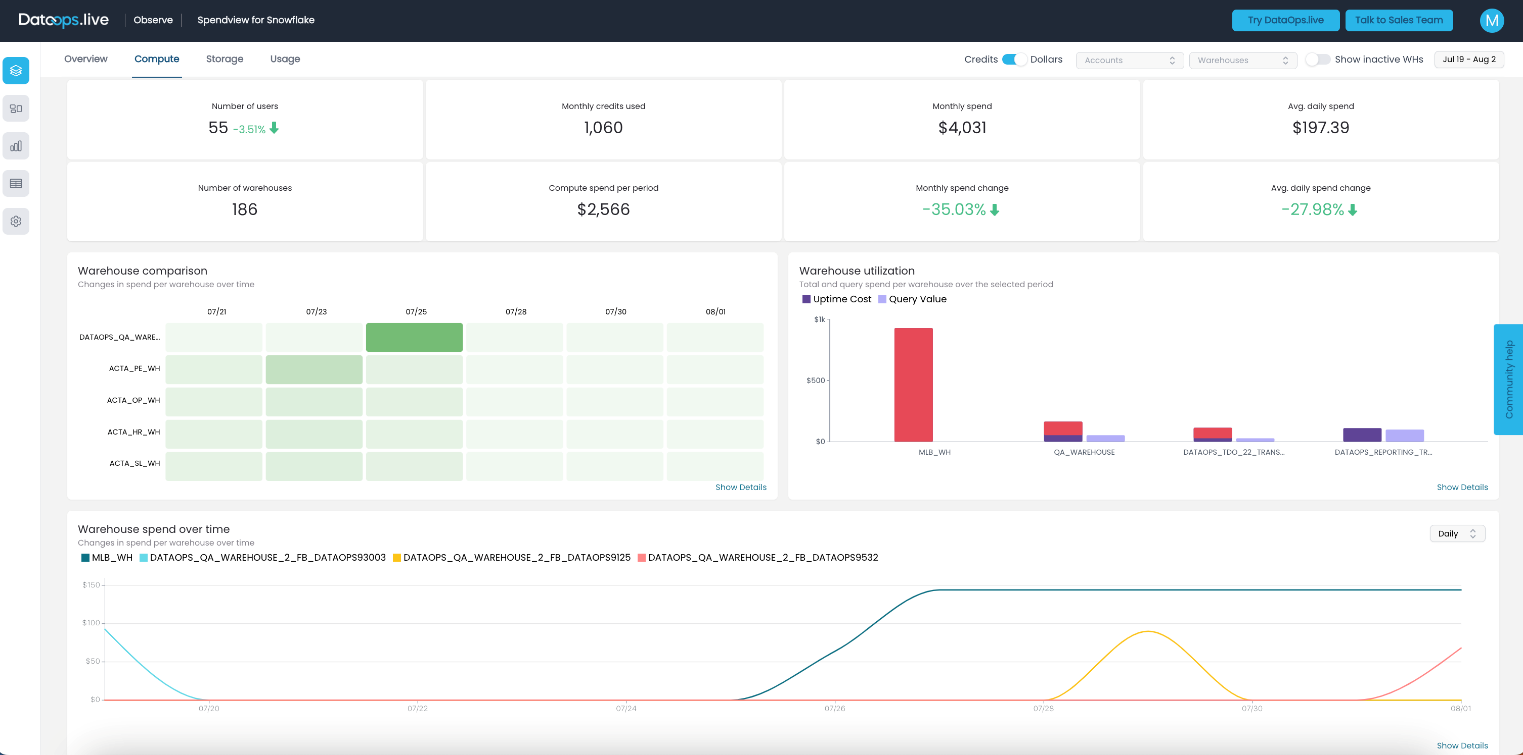
Finally, let's take a look at the compute usage for the current month:
As you can see, the non-utilized warehouse that we suspended on the 3rd of August is still one of the top spenders for this month, even though it only ran for 3 days. Among the other leading spenders, two warehouses are utilized at approximately 30-40%, while another one is being used at close to 100% uptime.
The first is used for Dev and QA purposes and it is an “X-small” size. Given the extensive testing, including our SOLE (Snowflake Object Lifecycle Engine) orchestrator features, it is hard to maximize its utilization further. The second is used in our demo projects, and it is a “Medium” size warehouse. While we could resize it to a smaller size for improved efficiency, we prefer to keep it medium to enhance the performance of our demo pipelines, allowing us to save valuable time for more meaningful discussions and interactions with our clients during our demos.
For more details on how to optimize your compute spent, you can read our two posts in our community portal:
Step 3: Identify Bottlenecks to Improve Performance
Spendview helps identify performance bottlenecks in well-utilized warehouses by showing warehouse spilling and queuing metrics.
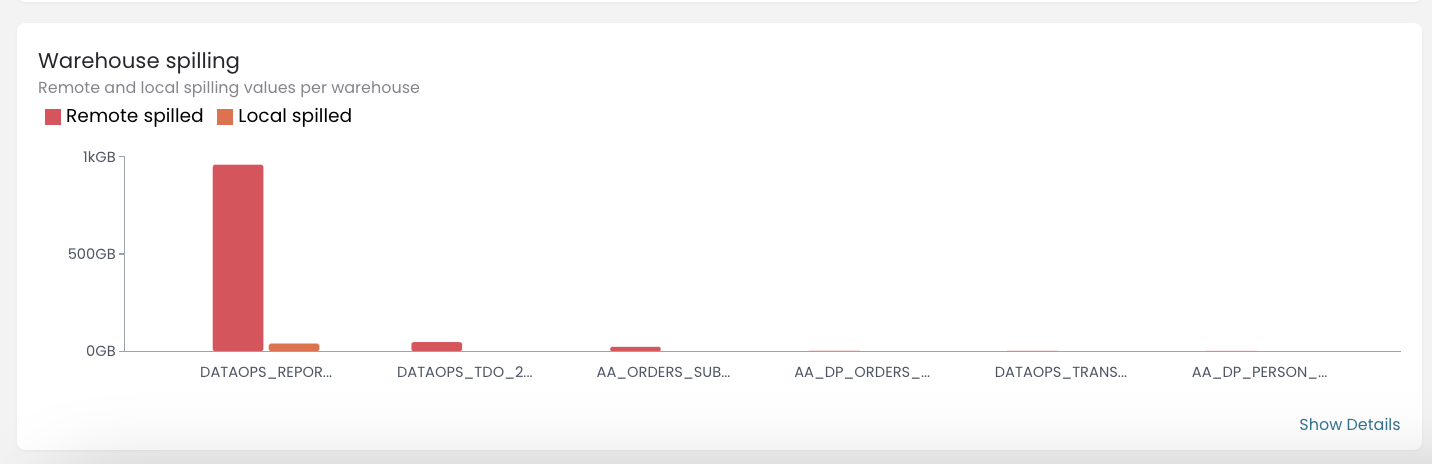
To find a bottleneck, I focus on the very well-utilized warehouses—those with more than 80% utilization. For these warehouses, I check the warehouse spilling and warehouse queuing metrics. Both metrics are available in the Spendview Usage tab:
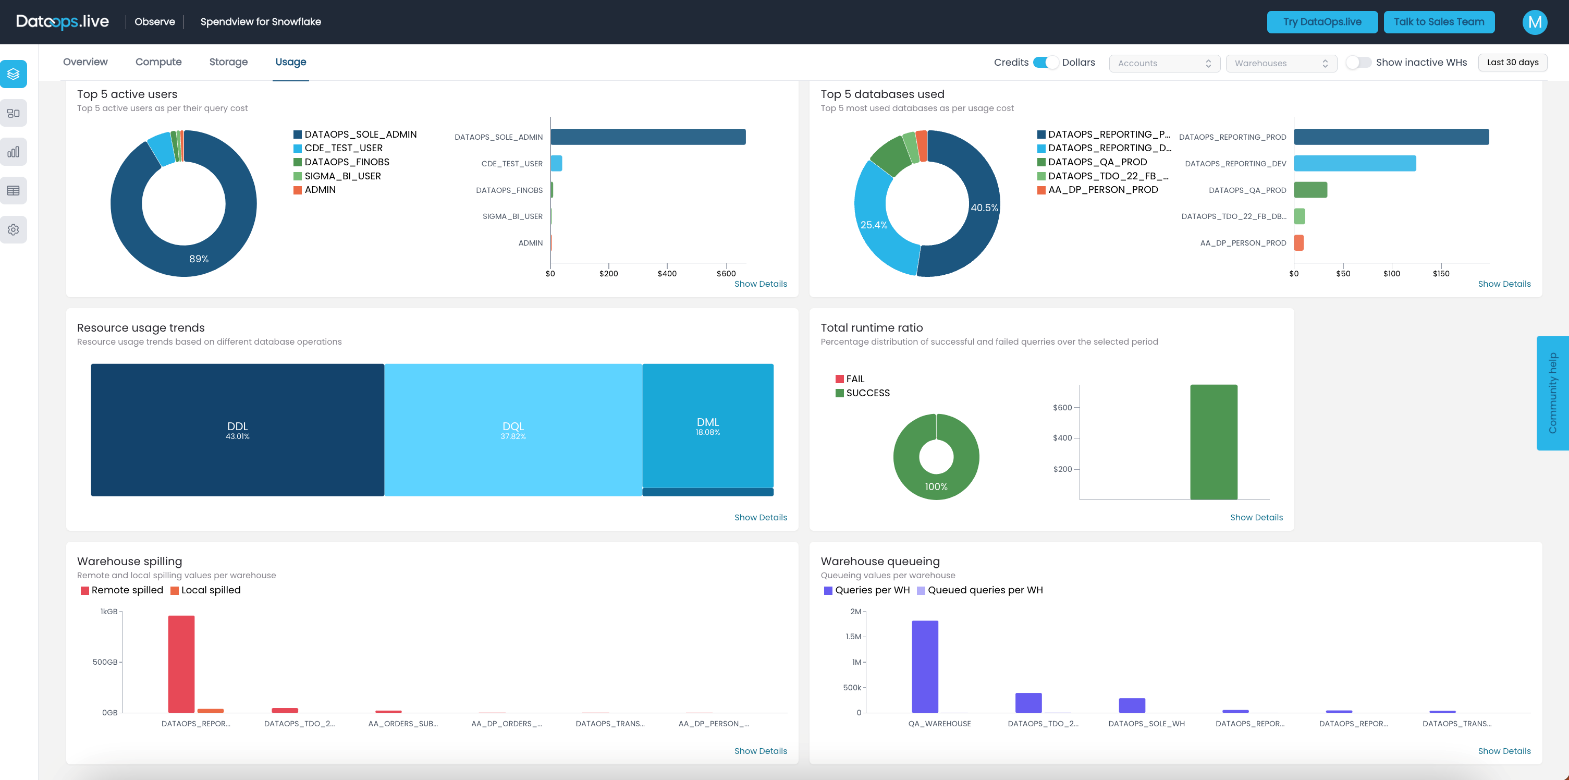
As you can see in the screenshot for the last month, we have around 1TB of remote spilled for the well-optimized warehouse; around 30 GB of network traffic per day. If we want to improve the performance of the pipelines using this warehouse, we can increase its size. However, we are currently quite happy with the performance of the pipelines, so we decide to keep the current size.
On the warehouse queuing chart, we can see that we don’t have any waiting queries which means that our query concurrency is good. If you see that for some warehouses, there are consistently a lot of queries queuing, you might consider moving some of the queries to another warehouse. Alternatively, you can explore the advantages of the multi-cluster warehouse feature that Snowflake provides.
You can find a detailed overview of these two graphs in our community post:
These are the three steps that I follow every week to ensure that our Snowflake spend remains effectively optimized. It takes me no more than 10 minutes to keep performance running smoothly and costs down. Thank you for reading!
Do you think Spendview is worth trying in your organization?
Give Spendview a try (it’s FREE) and please share your thoughts with us at the DataOps.live Community!


